To Cache or Not to Cache Virtual Threads

|
This article was substantially revised on 11 September 2026
The version published on 28 July 2026 explained what we measured with a cause that turned out to be wrong: the benchmark it rested on had a bug. Patricio Chilano Mateo questioned the explanation in a review of the original findings, and following that question is what turned the bug up. Everything below has been re-measured. The advice — don’t pool virtual threads — is unchanged; the reason for it is not. What exactly changed
The superseded version remains readable in the site’s history: the article as published on 28 July 2026. |
The official guidance on virtual threads is clear:
Virtual threads are cheap and plentiful, and thus should never be pooled: A new virtual thread should be created for every application task.

As part of our work on improving Quarkus performance with virtual threads and investigating Loom’s scheduling behavior, we wanted to know whether ignoring that advice is worth it — not in principle, but in bytes: what does pooling buy, what does it cost, and does either show up in throughput?
The short answer: pooling allocates about 8% less per request, exactly as advertised, and that changes nothing we can measure. It also keeps about 60 MB of heap alive for as long as the pool lives, and on a slightly smaller heap that is enough to change how the garbage collector behaves. It saves the cheap thing and keeps the expensive one.
Why Would You Pool Virtual Threads?
Pooling threads is a well-established pattern. We do it for platform threads in frameworks like Quarkus because they are expensive to create — each one maps to an OS thread with a pre-allocated stack. Virtual threads are designed to be cheap, so the architects of Project Loom say pooling is unnecessary. But a brave and careless developer might still consider it: creating a virtual thread allocates a Thread object, its thread-local storage, and internal scheduling structures. If you reuse virtual threads, you skip all of that.
The benchmark
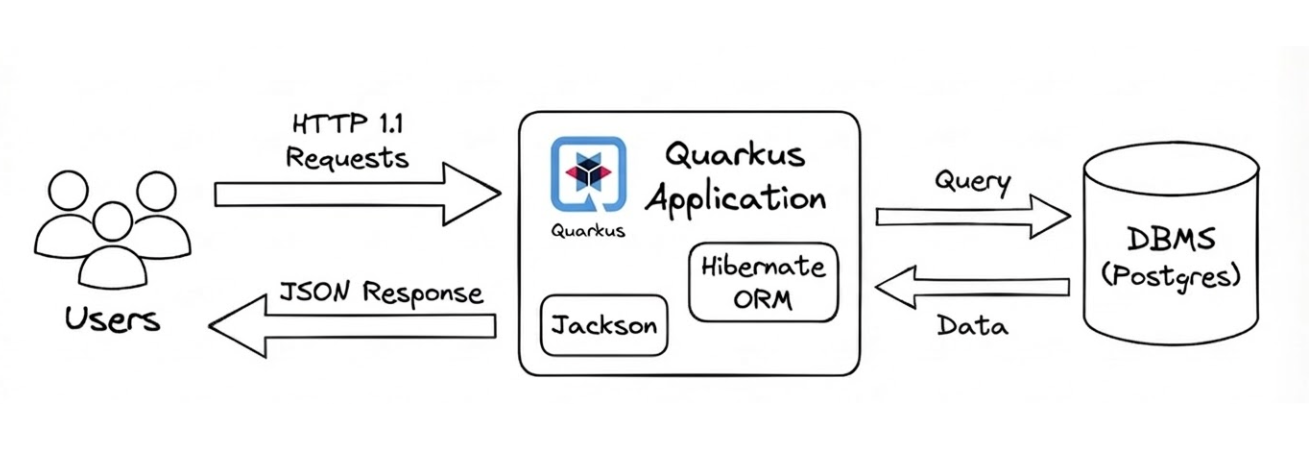
The workload we care about is the typical Java enterprise pattern: an HTTP server receives requests, dispatches each one to a virtual thread that performs blocking I/O, then returns a response.
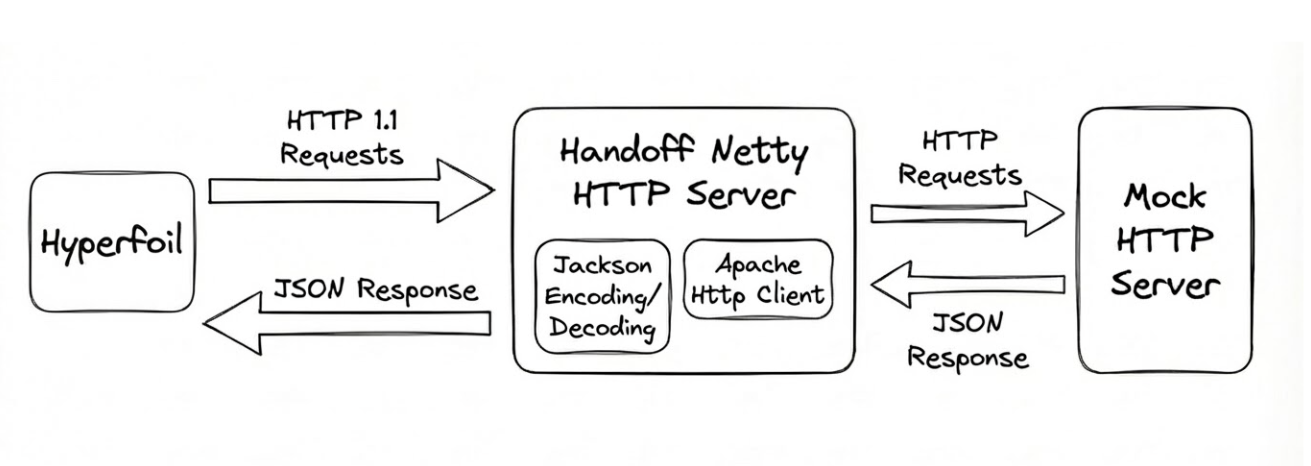
Ours simplifies that to its essential shape: a Netty HTTP server receives requests, hands each one to a VT that makes a blocking HTTP call (via Apache HttpClient) to a mock backend with 30ms think time, parses the JSON it gets back, then returns the response. 10,000 concurrent connections, 8 carriers, a 30-second warmup followed by a 30-second measurement phase. Two modes, which we will call unpooled — a fresh virtual thread created for every request, as JEP 444 prescribes — and pooled, an executor that parks finished virtual threads and reuses them, growing on demand up to 10,000 threads. With 10,000 connections all sending at once, it reaches that ceiling in the first seconds of every run. Every run uses ParallelGC; the cost we end up measuring is promotion behaviour, which is collector-specific, and we did not test G1.
Every figure below is a mean over repeated runs, with the range wherever the spread matters — averages hide outliers, and here the outliers turned out to be the most interesting thing we found.
What Pooling Buys
Start where the case for pooling is strongest — a 4 GB heap, room to spare:
| 4 GB heap | TPS |
|---|---|
unpooled |
165,344 |
pooled, 10,000 VTs |
170,182 |
Pooling wins, by just under 3%. The slowest pooled run still beat the fastest unpooled one.
One caveat: waking a pooled VT with LockSupport.unpark() queues it on the carrier’s local queue, while Thread.start() uses the external one (VirtualThread.java), so the 3% may be the queue rather than the allocation; nothing here separates them.
Now take the room away. Same benchmark, 1 GB heap, and this time we counted what was allocated — the sum of eden occupancy at every collection, from the GC log:
| 1 GB heap | TPS | allocation rate, measurement window | GC pause |
|---|---|---|---|
unpooled |
155,302 |
2,174–2,323 MB/s |
4.9 s |
pooled |
156,854 |
1,981–2,133 MB/s |
5.0 s |
The saving is real: 8.6% less allocation over the run, with both arms serving the same throughput to within 1%. Per request that is 14.8 KB against 13.6 KB — about 1.3 KB saved.
We did not identify what pooling allocates in exchange — and it does allocate something, because an unpooled thread’s frozen stack alone is a 2.2 KB object per request, so avoiding it should have saved more than 1.3 KB.
And the saving changes nothing downstream. Young collections, Full GCs (two in every run, both arms), pause time and throughput are all inside the run-to-run spread. Allocation that dies young is reclaimed by moving a pointer; 8% less of it is 8% less of something that was already nearly free.
What Pooling Costs
jcmd GC.class_histogram forces a Full GC and counts what is still reachable — the heap you cannot get rid of. Run mid-load, at the same point in every run:
| 1 GB heap | live heap | of which StackChunk |
|---|---|---|
unpooled |
389–422 MB |
5–13 MB (2.3–6.1K chunks) |
pooled |
453–505 MB |
69–93 MB (16.5–20.8K chunks) |
Pooling costs about 60 MB of live heap — about 6 KB per pooled thread — and StackChunk is the only class that grows: comparing one run of each kind, nothing else moves by more than a megabyte.
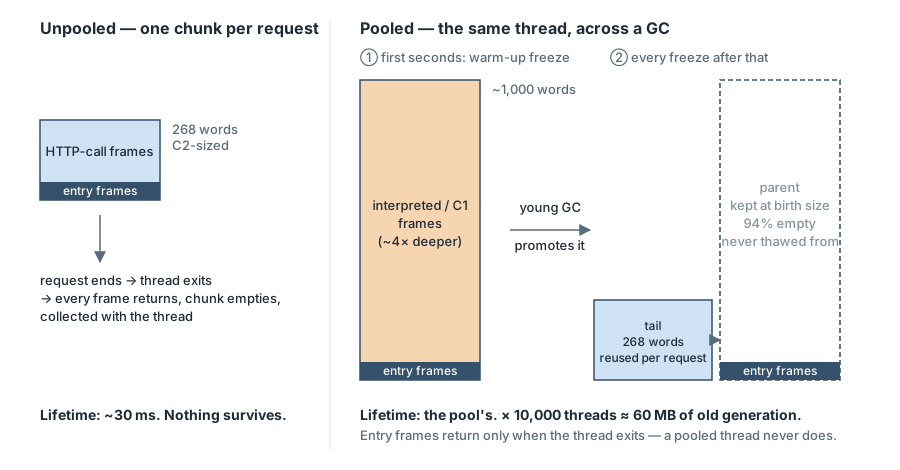
Where that 60 MB comes from. A blocked virtual thread’s stack is copied into a heap object that is sized once, for the stack it holds, and never resized. In the first seconds of a run the code is not yet C2-compiled, and code C2 has not reached needs about four times more stack words, so early freezes mint chunks of roughly a thousand words where a warm one needs 270.
A young collection then promotes that chunk, and a promoted chunk cannot take the next freeze: a fresh small one goes in front of it and the fat one stays behind. It stays for good, because the JVM unlinks it only once it is empty, and what it still holds is the thread’s entry frames — the ones that return only when the thread terminates, which a pooled thread never does.
Every pooled thread ends up carrying one, ten thousand of them is the 60 MB. An unpooled thread terminates with its request; its entry frames return, the chunk empties, and it dies with the thread. Pooling does not only retain threads. It retains the JVM’s warm-up state.
What a StackChunk is
When a virtual thread parks — blocks on I/O, waits on a lock, sleeps — the JVM frees the carrier thread by freezing the VT’s call stack: copying it into a StackChunk, a regular Java heap object holding an integral number of frames plus an oop bitmap so the GC can find references inside them. On unpark it thaws the stack back onto a carrier.
Sources: InstanceStackChunkKlass.hpp and continuationFreezeThaw.cpp, from JDK-8284161.
A heap dump of one run of each kind shows exactly that picture:
| heap dump, 1 GB | unpooled | pooled |
|---|---|---|
live virtual threads |
4,473 |
10,017 |
parent + tail pairs |
24 |
10,024 |
tail capacity |
— |
268 words, same as an unpooled chunk |
parent capacity |
— |
27% at ~270 words; 69% at 750–1,300 |
Every one of the 10,024 parents still holds 8 to 95 words — the entry frames, read out of the JVM by name — and seven in ten were born three to five times bigger than a tail. That size is warm-up code: with C2 disabled (-XX:TieredStopAtLevel=1) the same park freezes 1,184 words instead of 298; in a normal run, frames logged at freeze time are mostly interpreted at 3.8 s, all C1 by 4.2 s, and C2 by 4.4 s, by which point the chunks have stopped being fat. The pool’s threads are all promoted in those first seconds, and whatever they were holding then is what they keep.
And it is held whatever the pool is doing: at the instant of the 1 GB dump, half the pooled threads were sitting idle in the pool, and their chunks are the same size as the busy ones'. It is the cost of the pool existing, not working.
Where the 60 MB Lives
Sixty megabytes that never die is old-generation occupancy, and the old generation records where the start-up burst — 10,000 connections opening and sending at once — leaves each arm:
| after the start-up burst, 1 GB heap | old gen occupied, of 683 MB | old gen free |
|---|---|---|
unpooled |
367–417 MB |
266–316 MB |
pooled |
436–521 MB |
162–247 MB |
No overlap: pooled ends the burst with 60–100 MB less free old generation, in every run, and holds it for the life of the pool. At 1 GB that cost nothing we could measure.
|
What we observed on a smaller heap
On a 900 MB heap — 100 MB smaller, everything else identical, GC ergonomics logging on — four of twelve pooled runs went into hundreds of Full GCs (288, 595, 768 and 771), and three of them lost 39–48% of their throughput. None of eight unpooled runs did. In every one of those runs the collector logged, before each Full GC, that it had skipped the young collection because its predicted promotion exceeded the free space in the old generation ( We saw the same at 1 GB, twice in twelve runs. We can say what the collector did, not why these runs and not their siblings. |
Verdict
-
Pooling buys about 8% less allocation. Measured in every run, and it moves nothing — young collections, Full GCs, pause and throughput are all inside the spread. What it saves is the cheap thing.
-
It costs about 60 MB of live heap: one warm-up-sized chunk per pooled thread, 94% empty, held for the life of the pool whether the thread is working or idle. Budget about 6 KB of permanent old-generation heap per pooled thread.
-
That heap is old-generation occupancy: 60–100 MB less free old gen after start-up, every run. At 1 GB it cost nothing we could measure; at 900 MB a third of pooled runs and no unpooled run fell into hundreds of Full GCs — reported, not explained.
We tested one pool size, 10,000. The mechanism is per thread, so we would expect the cost to scale with the pool, but we did not measure that.
The advice was right. The reason is less dramatic than we expected: pooling saves the thing the collector was already handling for free, and keeps the thing it is not.
Thanks to Patricio Chilano Mateo, whose review of the original findings started all of this. The story it turned up is a better one than it replaced.
Referências
-
JEP 444: Virtual Threads — Ron Pressler & Alan Bateman
-
openjdk/loom#228, review comment — Patricio Chilano Mateo’s questions on the original article
-
JDK-8284161 — the commit introducing StackChunk and continuation freeze/thaw
-
continuationFreezeThaw.cpp— the freeze/thaw implementation

